4.5 Interactive Visuals
This section introduces how to create interactive health data dashboards using the Plotly library. It covers the installation of Plotly, building interactive scatter plots, and creating complete interactive dashboards using the Dash framework. The provided code snippets demonstrate the creation of an interactive scatter plot and a simple interactive dashboard.
Plotly is a powerful Python data visualization library that enables the creation of interactive, web-based visualizations and dashboards. This section explores how to leverage Plotly to build dynamic and interactive health data dashboards, allowing for in-depth exploration and analysis of complex medical datasets.
Installing Plotly
Before you get started with creating interactive dashboards, ensure you have Plotly installed. You can install it using the following command:
pip install plotly
Building Interactive Dashboards
Plotly's interactive capabilities are well-suited for healthcare data analysis, where stakeholders may want to explore and analyze data from various angles. You can create dashboards that allow users to select variables, filter data, and interact with plots in real time.
Here's a basic example of how to create an interactive scatter plot using Plotly:
import plotly.express as px

# Load your healthcare dataset into a pandas DataFrame (assuming df)

# Create an interactive scatter plot
fig = px.scatter(df, x='cholesterol', y='blood_pressure', color='condition',
                 hover_name='patient_id', title='Cholesterol vs. Blood Pressure by Condition')
fig.update_layout(xaxis_title='Cholesterol', yaxis_title='Blood Pressure')
fig.show()
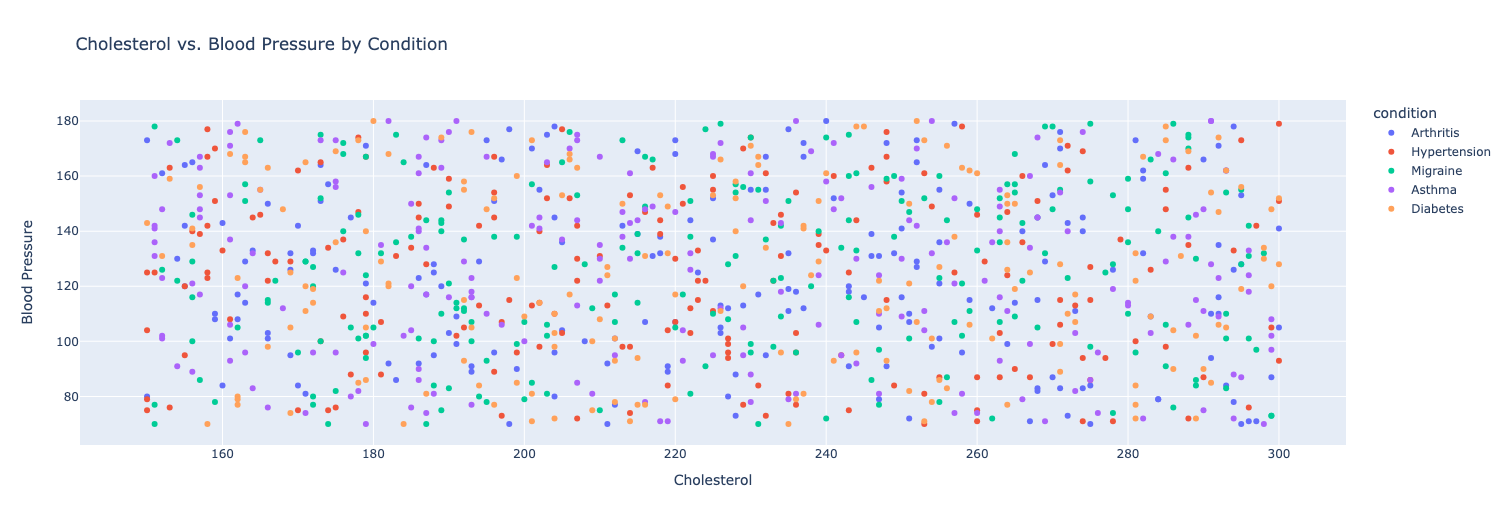
In this example, the px.scatter function from Plotly Express is used to create an interactive scatter plot. Users can hover over data points to see additional information and can click on the legend to toggle the visibility of data points belonging to different medical conditions.
Creating Interactive Dashboards
Plotly allows you to create entire interactive dashboards with multiple plots and components. These dashboards can be embedded in web pages or shared as standalone files. The dash library from Plotly provides a framework for building web-based dashboards with Python.
In this example example app.py, we would then run or deploy this app with python app.py:
import dash
import dash_core_components as dcc
import dash_html_components as html
from dash.dependencies import Input, Output
import pandas as pd
import random
import plotly.express as px

# Sample data generation
conditions = ['Diabetes', 'Hypertension', 'Asthma', 'Migraine', 'Arthritis']
data = {
    'cholesterol': [random.randint(150, 300) for _ in range(1000)],
    'blood_pressure': [random.randint(70, 180) for _ in range(1000)],
    'condition': [random.choice(conditions) for _ in range(1000)],
    'patient_id': [f'P{1000+i}' for i in range(1000)]
}
df = pd.DataFrame(data)

app = dash.Dash(__name__)

# Define your layout with components
app.layout = html.Div([
    dcc.Graph(id='scatter-plot'),
    dcc.Dropdown(
        id='condition-dropdown',
        options=[{'label': cond, 'value': cond} for cond in conditions] + [{'label': 'All', 'value': 'All'}],
        value='All'
    ),
])

@app.callback(Output('scatter-plot', 'figure'), [Input('condition-dropdown', 'value')])
def update_scatter_plot(selected_condition):
    if selected_condition == 'All':
        filtered_df = df
    else:
        filtered_df = df[df['condition'] == selected_condition]

    fig = px.scatter(filtered_df, x='cholesterol', y='blood_pressure', color='condition',
                     hover_name='patient_id', title='Cholesterol vs. Blood Pressure by Condition')
    fig.update_layout(xaxis_title='Cholesterol', yaxis_title='Blood Pressure')
    return fig

if __name__ == '__main__':
    app.run_server(debug=True)
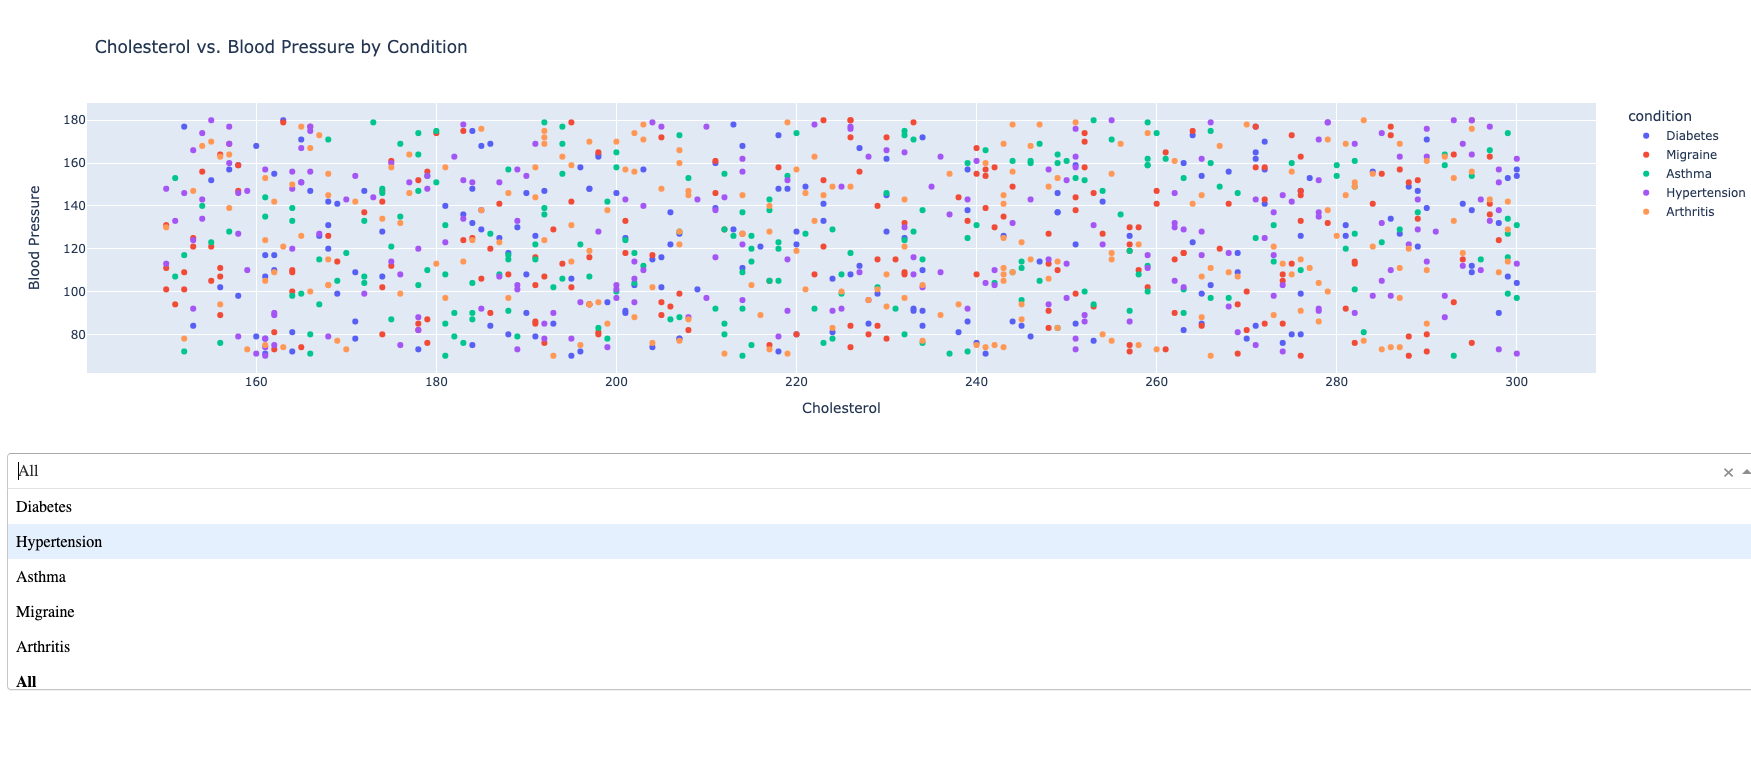
In this code snippet, a simple interactive dashboard is created using the Dash framework. The dashboard contains a scatter plot and a dropdown component for selecting different medical conditions. The update_scatter_plot function is a callback that updates the scatter plot based on the user's selection.
For running the above example: would recommend looking at the Google Shell Environment which comes with a VS-code like IDE where you can quickly check out the example in the cloud.
Here is a video example of Dash running with the above code
With Plotly, you can create visually appealing and interactive dashboards that empower stakeholders to explore healthcare data and gain insights from various perspectives.